
Timing vs Time In the Market
Yup, we’ve officially had the first (of likely a few) rate cuts. The Bank of Canada led the way a few months ago and just this past week the Federal Reserve followed suit announcing a 50bps (0.5%) rate cut. Typic. We may be heading towards RISK ON mode. However, if you place that against the geopolitical uncertainty occurring across the globe at the moment, including the US election in two months, you may be scratching your head what to do with your investments.
Fortunately, we have professionals, who spend their lives forecasting what the future may hold. As humans, we are hardwired to avoid uncertainty, that’s why these forecasts provide us a modicum of comfort. Nevertheless, the track record of economic forecasts have not have a favourable track record.
Interest Rates and Inflation: Inflation is expected to continue easing compared to 2022–2023, but still remains a concern. Central banks, including the Federal Reserve, are projected to maintain elevated interest rates (relative to years past) throughout 2024 into 2025 (which still allows for rate cuts). These rates affect both borrowing costs and corporate earnings, making market conditions somewhat unpredictable for investors(
Timing the Market vs. Time in the Market: Timing the market, which involves actively buying and selling based on short-term market movements, can seem appealing in uncertain conditions. However, consistent success with this strategy is notoriously difficult, and most data continues to support the "time in the market" approach—staying invested long-term—since missing just a few of the best days in the market can greatly reduce overall returns (more on this below)
Volatility: 2024 is anticipated to be volatile, driven by political uncertainties (e.g., U.S. elections and potential gridlock), global supply chain issues, and ongoing tensions in key global markets. Investors with a long-term perspective, embracing "time in the market," may find more resilience against these fluctuations.
This has created a lot of fear and uncertainty in the market. These two emotions are the perfect kindling for the panic bonfire. It appears that nothing is spared from the sell-off we have experienced in recent weeks and months. Just take a look at the fear and greed index. At the time of writing, it is at a 62 (GREED). At the depths of the pandemic, it was at a 6. There are a few pundits who are still sounding the alarms about the following possibilities.
👉 Global recession 📉 (in the past, rate cuts have preceded a recession)
👉 Inflation is still quite elevated 📈
👉 Unemployment rate continues to rise 📈
👉 The impending housing market implosion 📉
I’m not saying there isn’t some truth to these headlines but they often publicize the problem and offer little to no actionable steps or solutions. Fear sells.
I’m going to drop some knowledge bombs on you and allow you to stay somewhat calm and trust the data.
During these uncertain times, I often get questions like
Should I sell everything now and wait until the bottom and get back in? In theory, yes, but good luck trying to time the market (see below)
Why don’t I just wait until the market has hit rock bottom and then drop a lump sum into it? Haha, do you have a crystal ball, and were you able to time the following tops/ bottoms in the stock market? Nope, I didn’t think so.
Recent Bottoms:
S&P 500 bottomed Oct. 9, 2002, following a 2.5-year bear market
S&P 500 bottomed March 9, 2009, after declining 57%
S&P 500 bottomed March 23, 2020 after declining 35%
Recent Tops:
S&P 500 topped March 31, 2000
S&P 500 topped Oct 12 2007
S&P 500 topped Feb 14, 2020
S&P 500 topped Nov 26 2021
3. What’s the point of dollar cost averaging if I know stocks are going to go down?
Let me show you what the data illustrates on why historical people who have had more time in the market have returned better performance than people who have tried to time the market

Don’t Miss The Best Days Part 1
Fidelity highlights the importance (using a $10 000) of keeping invested throughout a 40-year period. It clearly illustrates that if you invested $10 000 in 1980 and kept that amount (you did not sell), in March 2020 you would have $697 421.
Conversely, if you missed the best 5 days, you would only have $432 411 ( $265 010 difference).
If you missed the best 50 days, you would only have $48 434 ($648 987 difference).
Take-home point: Keep invested, don’t try to time the market

Don’t Miss the Best Days Part 2
Bloomberg produced a similar graphic. The timeframe is from 2001-2020 and instead looks at percentage gains vs absolute dollar amounts.
It clearly illustrates that if you invested you held the S & P 500 in 2001 and held it, (you did not sell), in March 2020 you would have returned an average of +7.5%
Conversely, if you missed the best 10 days, you would only have returned +3.4%
If you missed the best 30 days, you would have actually returned an average of -1.5%
AND if you missed the best 40 days, you would have returned an average of -3.4%
Take-home point: Keep invested, don’t try to time the market

Don’t Miss the Best Days Part 3
Edward Jones sums it up nicely and packages the above charts into one.
Take a look at what a $10 000 investment in 1998 in the MSCI (Morgan Stanley Capital International) Canada would yield in both dollar and percentage amounts if you excluded the best 10/20/30/40 and 50 days.
Take home point: Keep invested, don’t try to time the market
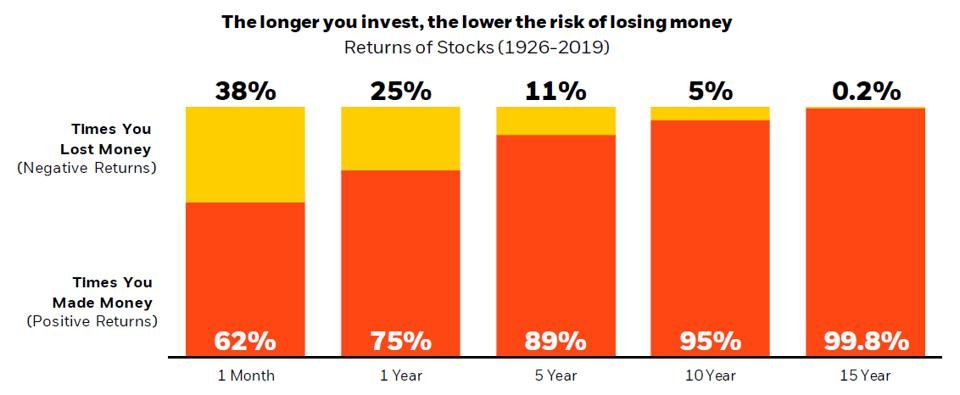
The longer you invest, the lower risk of you losing money
Forbes backtested about 93 years of stock market data and compares the risk of losing money over the time horizon of investing. As the chart depicts, the likelihood of losing money reduces significantly the longer the investment horizon. For example over a 15 year time frame you have a 0.2% of losing (negative return) money. Said differently, you have a 99.8% of having a positive return (making money) over 15 years.
Take home point: Keep invested, don’t try to time the market
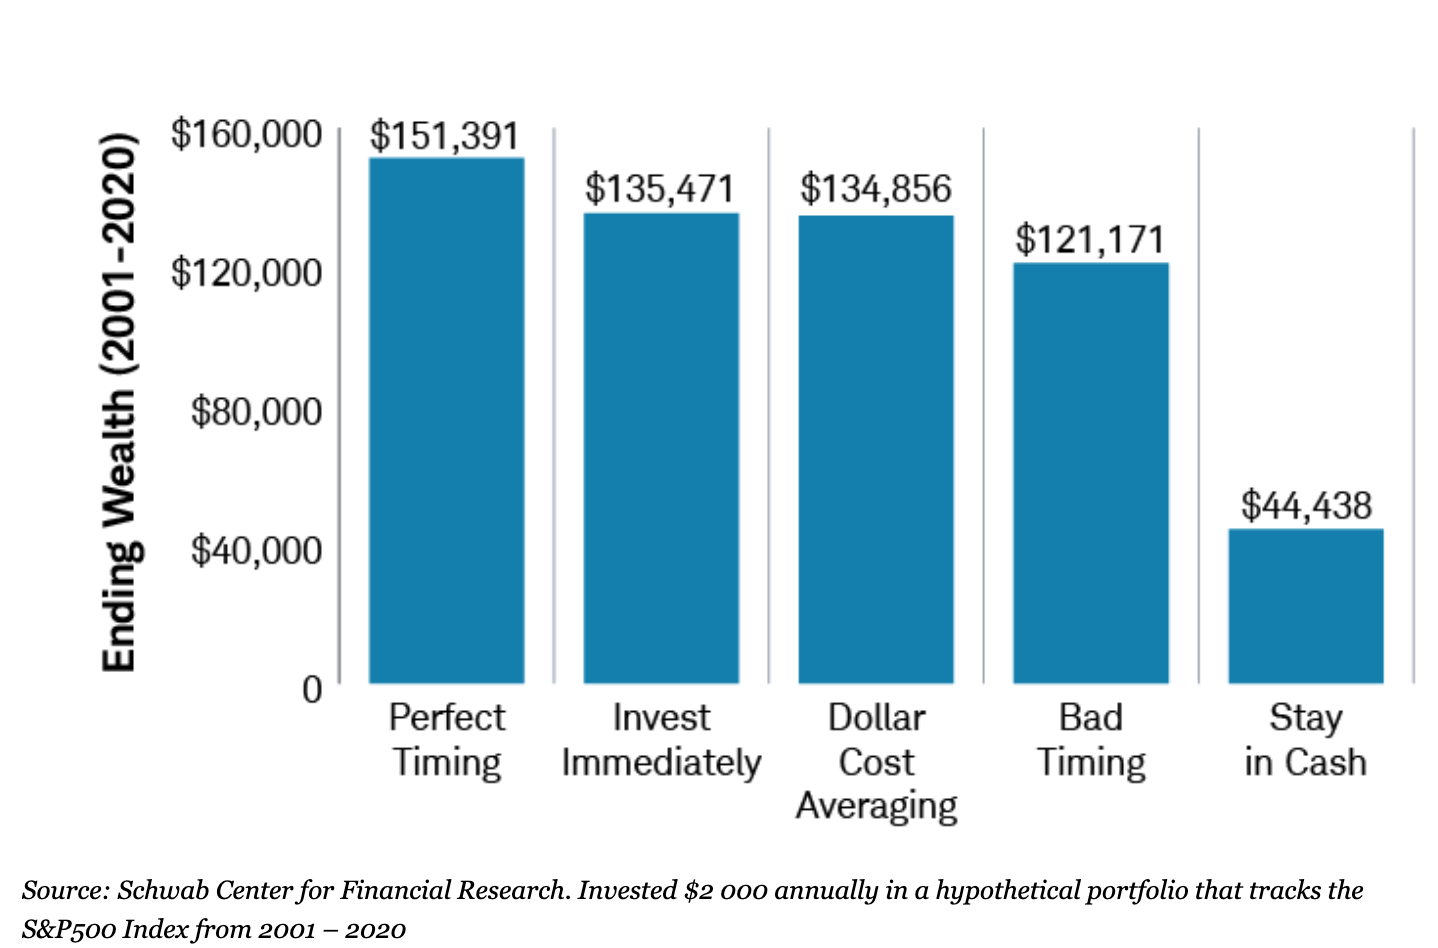
Even Bad Timing Trumps Inertia
Given the difficulty of timing the market, the most realistic strategy for the majority of investors would be to invest in stocks immediately.
Procrastination can be worse than bad timing. Long term, it's almost always better to invest in stocks—even at the worst time each year—than not to invest at all.
Dollar-cost averaging is a good plan if you're prone to regret after a large investment has a short-term drop, or if you like the discipline of investing small amounts as you earn them.
Time in the market beats market timing because it's like the tortoise winning the race - slow and steady. Here's why it tends to be superior:
1. Less Stress: Market timing can be a rollercoaster of emotions, but time in the market lets you chill. You're in it for the long haul, so you don't sweat the small ups and downs.
2. Money Magic: Time is your investment's best friend. The longer you're in, the more your money multiplies through the magic of compounding. It's like planting a money tree.
3. Save Cash: Frequent buying and selling can be expensive. With a long-term strategy, you save on transaction costs and taxes. More money for you!
4. Happy Investing: Market timing can be stressful, but a long-term approach lets you enjoy life without constantly checking stock prices. It's a happier, more relaxed way to invest.
So, embrace the slow and steady approach, and watch your money grow over time. It's like planting the seeds for a financial garden that'll bloom beautifully in the future. 🌱💰😊


There are always those people who profess that they can time the market. I’m definitely not one of those people. Instead I use a tried and true approach backed with evidence to shape my investing decisions.